Fleet Cost Center: now you really know how much each vehicle costs
Public release scheduled: June 15, 2026
TCO, cost per kilometer, and monthly spend for every vehicle in one view: the new Fleet Cost Center turns your fleet data into decisions.
With the release of the Fleet Center inside youMove's Fleet Management module, you no longer have to do that work. The platform does it for you. The Fleet Center brings the entire life of your vehicles into a single area: in this article we focus on the Cost Center, but right next to it you also find usage analysis and vehicle ranking.
What changes in practice
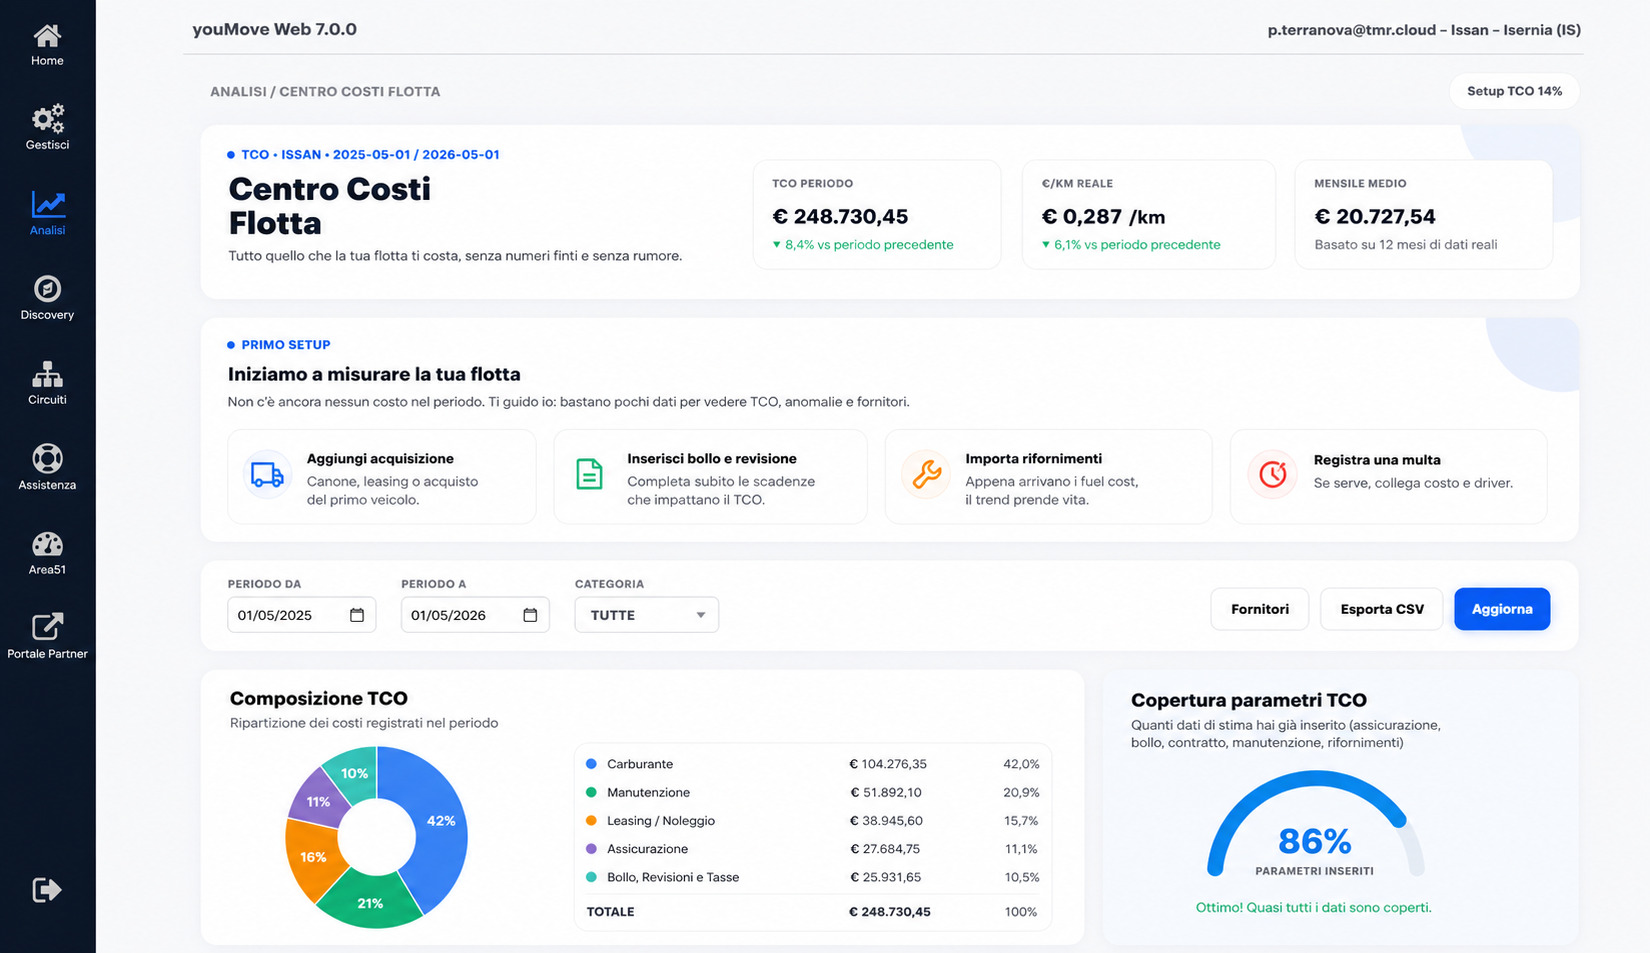
The Fleet Cost Center is a new dedicated section that collects, structures, and analyzes all fleet costs in a single view. It is not a static report to export: it is a live dashboard that updates as you enter data and integrates with the telemetry already available on the platform.
When you open the section, you immediately see three numbers that capture the situation:
- Period TCO — the fleet's total cost of ownership over the selected interval, with a trend indicator compared with the previous period.
- Cost per kilometer — the actual cost per km driven, calculated from real telemetry data, not declared estimates.
- Average monthly cost — the average monthly spend over the selected period.
Below, the system shows anomalies and alerts: upcoming deadlines, vehicles with missing data, cost items outside the expected range. No dashboards overloaded with useless metrics: only signals derived from real data, each with an associated action.
Analysis by category and by vehicle
The operational core of the Cost Center is made of two analysis sections.
Analysis by category shows the monthly trend of real costs divided by macro item — acquisition, fuel, insurance, road tax, fines, other costs — and the composition of the overall TCO. In a few seconds you understand where the spend is: if acquisition accounts for 84% and fuel only 4%, you know where to look for optimization and where the room for maneuver is minimal.
Analysis by vehicle flips the perspective: it compares individual vehicles by total cost and shows the TCO composition vehicle by vehicle. A separate table lists the most expensive vehicles in the fleet, ordered by TCO and by real anomalies detected, with a trend chart at a glance. It is the view you use when the general manager asks, "which van is costing us money?" Now the answer is one row.
Not just costs: fleet usage and ranking
The Cost Center is only one soul of the Fleet Center. Alongside the economic analysis there is usage analysis, which measures how much each vehicle actually works: kilometers driven, active hours, idle days. No longer just "how much does it cost me," but "how much am I using it."
From this comes the fleet ranking: the platform sorts vehicles from most used to least used, so you can spot at a glance the one that never stops and the one that sits parked, generating costs without producing value. It is by crossing usage with cost that the picture becomes truly useful: an expensive vehicle used to the fullest is a good investment; a rarely used, expensive one is the first candidate for disposal or reallocation to another circuit.
Usage analysis relies on telemetry: kilometers and engine hours read from the device. That is why costs and usage live together in the Fleet Center, but on different plans. Costs are available even without hardware, on the base plan; usage and ranking arrive with telemetry, on plans with a device, where the numbers carry the detail you need to decide.
That is where the Fleet Center starts answering the questions that really move the budget: when it pays to replace a vehicle, whether the fleet is larger than needed, which vehicles to rotate to even out wear, and — when kilometers and hours can be attributed to a site or job — how much the fleet really weighs on a single job. No promises of prediction: just the same data, read well.
Progressive setup, not an 80-field onboarding
One design decision is worth explaining: the Cost Center does not require you to fill in everything before you start using it. The platform starts from 20% data coverage and guides you step by step toward completion, explicitly showing the completion percentage and open items. The message is clear: "I only show you what is truly missing: let's complete one data point at a time, without rushing."
You immediately see the data you already have, and as you add cost items or suppliers, the analysis becomes richer. This avoids the classic problem of administrative modules that remain empty because nobody ever wants to complete the initial setup.
Export and suppliers
Below the analyses you find two practical buttons:
- Suppliers — the list of your active suppliers (workshops, insurers, fuel providers) with the associated spending volume. Useful for negotiating renewals with real numbers in hand.
- Export CSV — the entire cost center exported for external analysis or accounting.
The filters at the top of the section let you narrow the analysis by year, category, vehicle subset, and display type. No hidden menus: everything visible, everything one click away.
Why we worked on it
Fleet management is not only "where are my vehicles now." Knowing where they are and how they move is the foundation, but the real value of a connected fleet emerges when operational data (kilometers, engine hours, driving style) intersects with economic data (acquisition, maintenance, fuel). The Fleet Cost Center is where these two worlds start talking to each other.
From today, on all circuits with the Fleet Management module active, the section is available from Analytics -> Fleet Center, where you find costs, usage, and vehicle ranking together.